
Reading Fajardo weather without confusing climate and forecast
Fajardo weather matters differently for a beach visit, an open-water boat trip and an evening paddle through the mangroves. A climate table describes the background pattern; the actual conditions determine whether a particular outing will operate. Use monthly figures to understand the region, then make daily choices with the current forecast and the instructions for your activity.
The figures here come from NOAA NCEI's Roosevelt Roads station, a regional coastal reference outside Fajardo. They cover the normal period 1991 to 2020 and were published in a station report generated on 5 November 2026. They are not readings taken at Seven Seas Beach or Laguna Grande. For choosing a travel window rather than interpreting the measurements, continue to the best time to visit Fajardo guide.
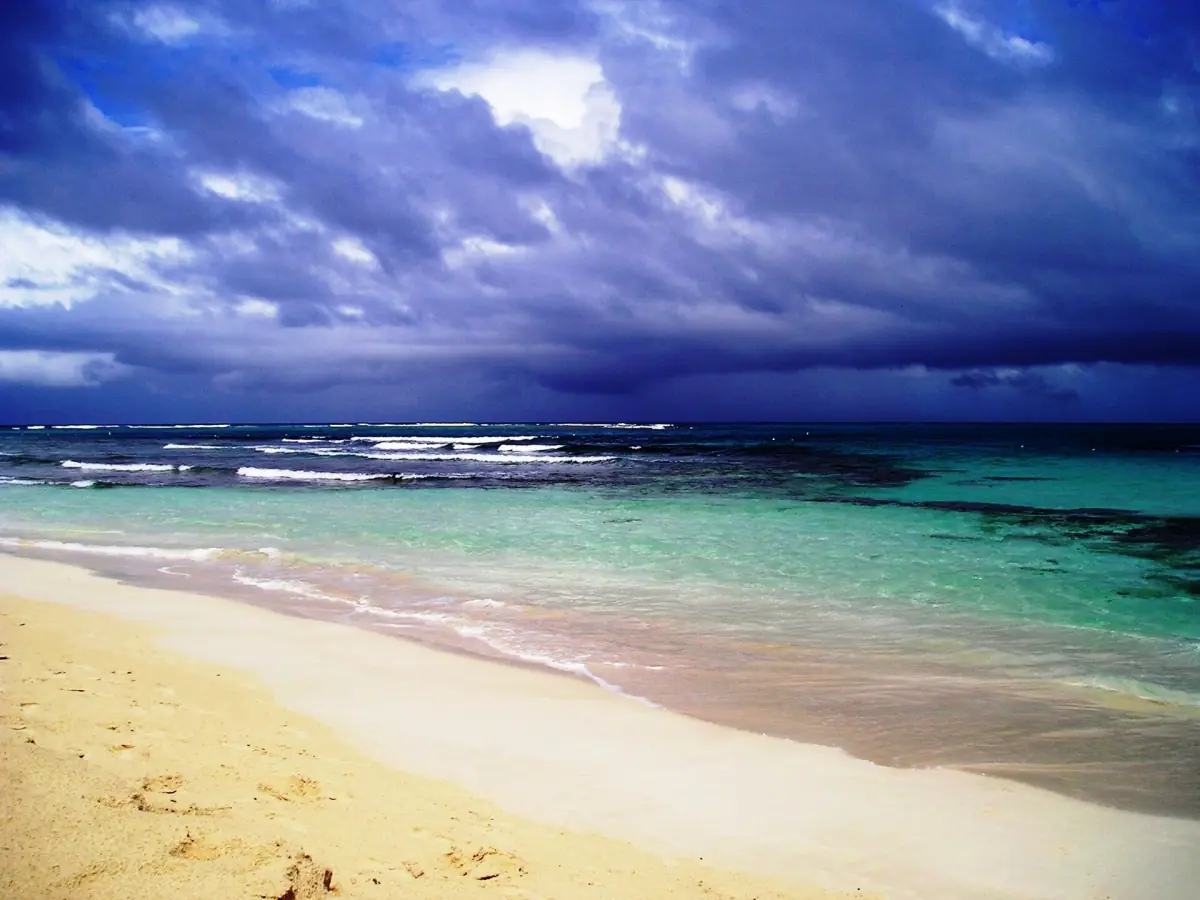
Temperatures: what the monthly columns mean
The maximum column is the mean daily maximum for that month, and the minimum column is the mean daily minimum. Neither is an absolute record or a promise about the hottest afternoon or coolest night during your stay. The source measurements were supplied in Fahrenheit, then converted to Celsius and rounded to one decimal place.
January has a mean daily maximum of 28.3°C and minimum of 21.9°C at the reference station. August's corresponding values are 31.7°C and 25.3°C. These figures describe a warm coastal setting while still leaving room for day-to-day variation. Plan clothing and time outdoors around the immediate conditions as well as the season. An evening kayak outing and a daytime beach stop involve different exposure even when they fall within the same monthly average.
A weather-dependent lagoon paddle
This guided lagoon outing includes instruction, while visibility depends on conditions.
Hand-picked tours, booked through Viator. Prices are indicative starting prices in US dollars (as of October 2026). Tap a tour for live availability and the current price in your currency.
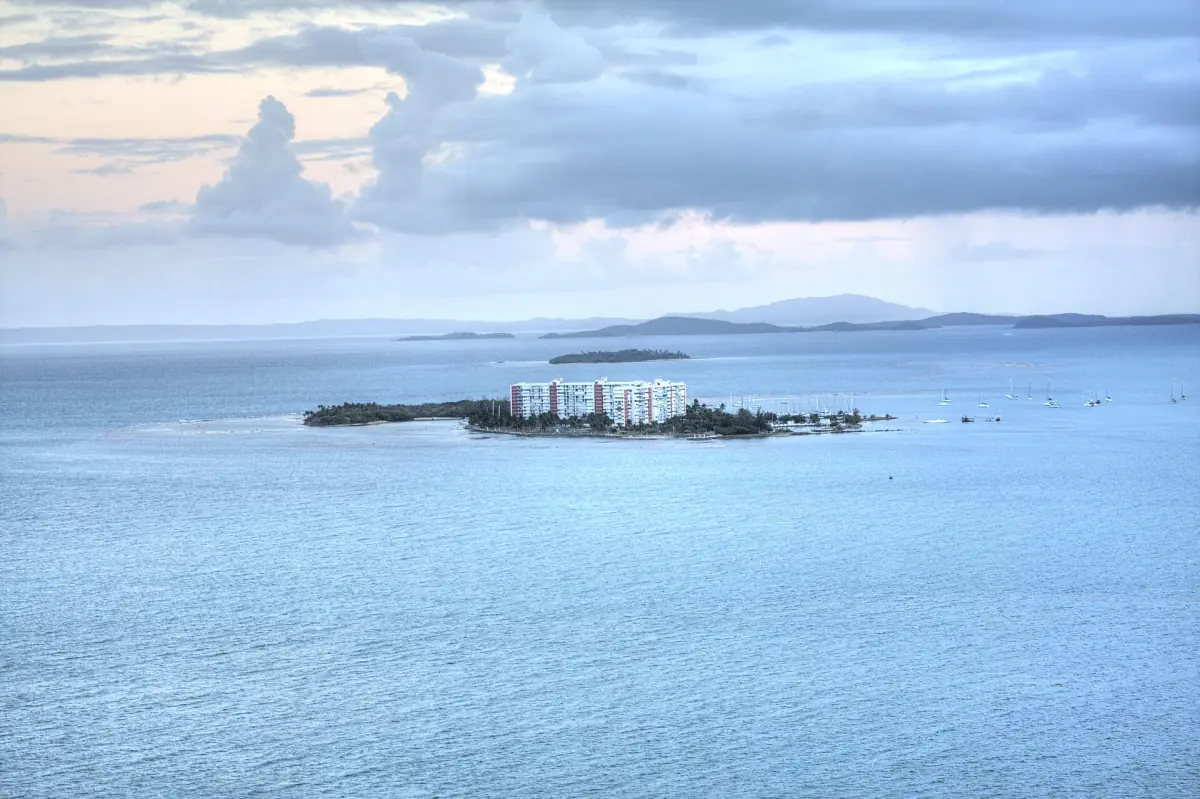
A weather-dependent lagoon paddle
A guided night kayak outing with instruction and ecosystem commentary; participants must swim, be at least 6 and weigh at most 240 lb each.
Monthly rainfall and the regional climate table
The rainfall column gives mean monthly precipitation, not a daily allowance or a count of rainy days. NOAA's original inch values have been converted to millimetres and rounded to one decimal place. The timing of wet hours, the length of showers and conditions for swimming require information for the specific day.
The reference series shows comparatively lower rainfall from January to March, a pronounced May value and higher values in September, October and November. Treat that as a regional planning pattern rather than a guarantee of dry days or persistent rain. Every month in this table has recorded average precipitation. Keep its purpose separate from the boat trip decision, which also depends on sea conditions and the actual departure.
| Month | Mean daily maximum °C | Mean daily minimum °C | Monthly precipitation mm |
|---|---|---|---|
| January | 28.3 | 21.9 | 66.5 |
| February | 28.6 | 21.9 | 50.0 |
| March | 29.0 | 22.2 | 46.7 |
| April | 29.9 | 22.9 | 75.9 |
| May | 30.4 | 24.1 | 170.4 |
| June | 31.2 | 25.2 | 99.1 |
| July | 31.6 | 25.2 | 109.5 |
| August | 31.7 | 25.3 | 109.7 |
| September | 31.6 | 24.7 | 162.6 |
| October | 31.3 | 24.3 | 146.0 |
| November | 30.1 | 23.6 | 154.2 |
| December | 28.9 | 22.7 | 101.3 |
Short-term beach and storm warnings
The National Weather Service San Juan beach forecast distinguishes rip-current risk levels. Moderate risk means life-threatening rip currents are possible; high risk means they are likely. Even a low rating leaves hazards around reefs, jetties and inlets. A pleasant temperature or a bright patch of sky does not replace that assessment. Use the current beach report when planning time in the water at Seven Seas.
If caught in a rip current, do not swim directly against it; the NWS advice includes moving parallel to shore to get out of the current. Follow local warnings. For sea excursions, account for swell, wear the life jacket as instructed and allow for weather-related cancellation or changes of destination. The Atlantic and Caribbean hurricane season runs from 1 June to 30 November. Outside that window, storm-free conditions are still not assured.
Weather and a Laguna Grande kayak outing
Laguna Grande's light is produced by microscopic organisms when the water moves. Weather and moonlight affect how it is perceived, with visibility varying from one evening to another. Choose a guided visit with realistic expectations about a changing natural phenomenon. The bio bay guide explains the setting and moon phase in more detail.
The lagoon outing featured here lasts 90 minutes and starts at Kayaking Village on PR-987, kilometre 6.8. It includes a kayaking lesson, a two-person kayak, an approved life jacket and ecosystem commentary in English or Spanish. Participants must be able to swim, be at least 6 years old and weigh no more than 240 pounds per person. A waiver is required. Those participation conditions remain relevant whatever the monthly average, and the light's intensity remains weather-dependent.
Frequently asked questions
Are these measurements from a Fajardo weather station?
They are NOAA normal values from Roosevelt Roads, used explicitly as a regional coastal reference outside Fajardo. They do not describe a dedicated station at the lagoon or beach.
Does high monthly rainfall mean it rains all day?
The table gives a mean monthly total. It does not describe the timing, length or distribution of rain on a particular day, so use the short-term forecast for your outing.
Can the rainfall table predict bioluminescence?
No numerical rain threshold is used here. Visibility changes with weather and moonlight, and the lagoon experience remains a natural event with variable brightness.